Getting started
Running a monthly review
More sources and clients
How the numbers work
Reading the revenue movement
What each movement means, and how to check it adds up.
The revenue movement is the core of every review. It starts from last month's revenue, applies each change, and lands on this month's.
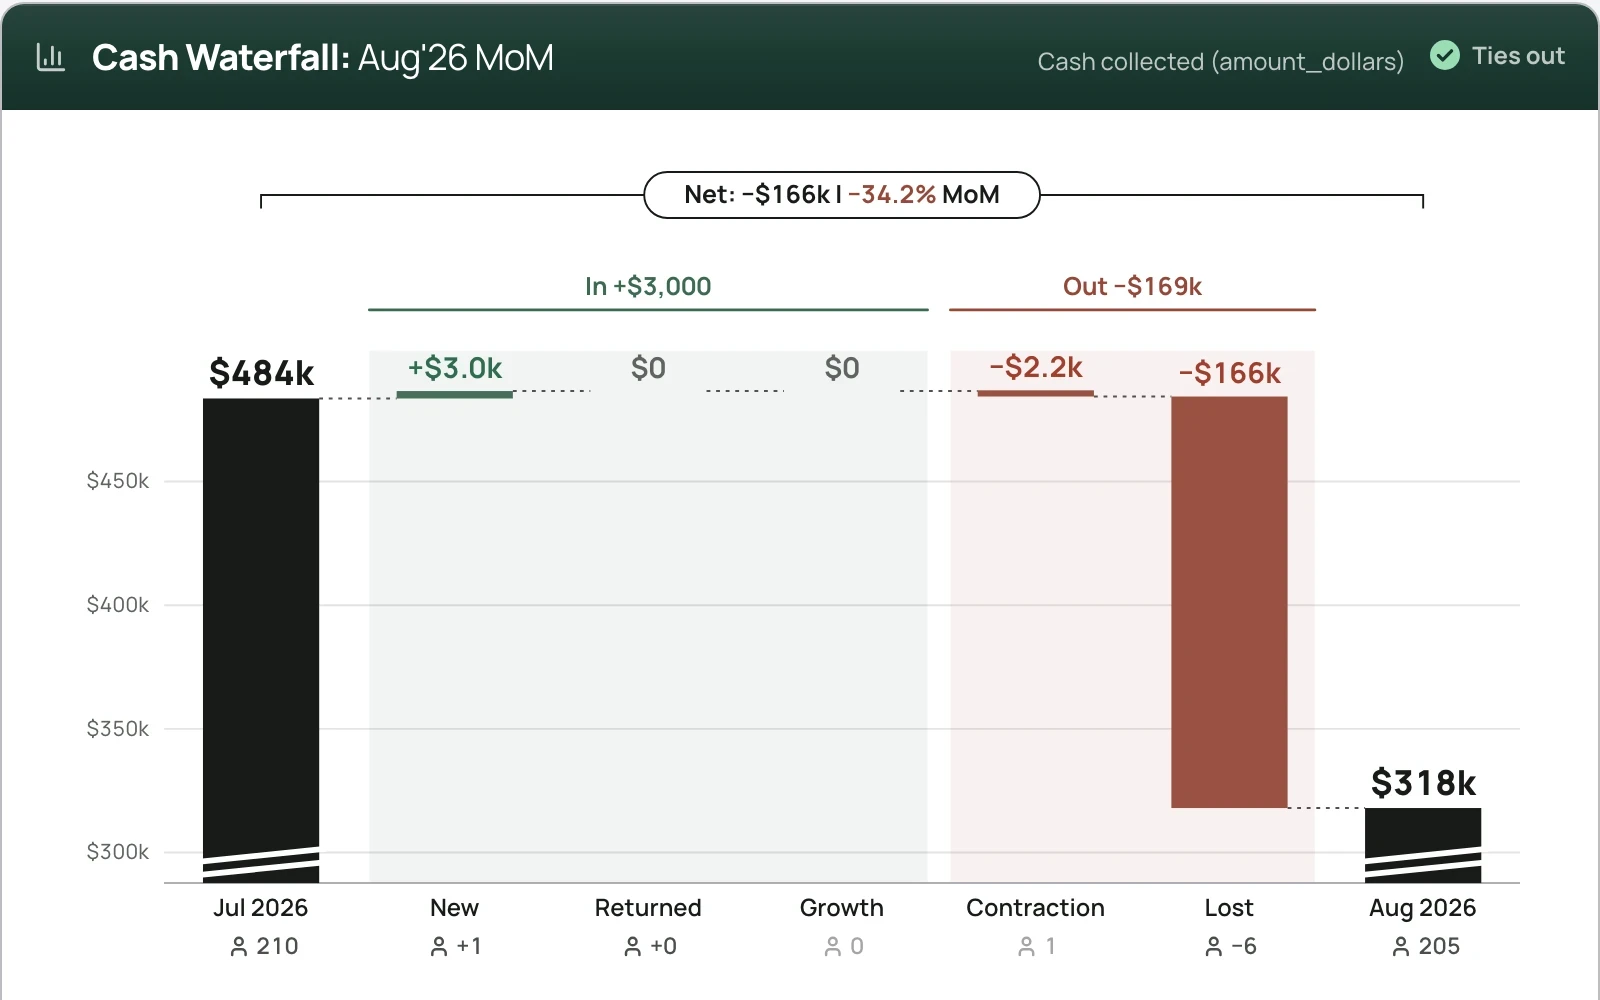
What each movement means
Starting | Revenue from last month. |
New | Customers who paid this month with no earlier payment in your files. |
Returned | Customers who paid this month after a gap, having paid before. |
Growth | Existing customers who paid more than last month. |
Contraction | Existing customers who paid less than last month. |
Lost | Customers who paid last month and nothing this month. |
Ending | Starting plus every movement. |
Customer counts appear under New, Returned and Lost. Growth and Contraction change amounts but not the number of customers.
Note. In the first month your files cover, there is no earlier month to compare with, so every paying customer shows as New. Review from the second month onward.
The same movements can be drawn month by month, up to 36 months back, in a window of six, twelve, twenty-four or thirty-six months.
What the movements can and cannot tell you
The movements describe what was paid, which a billing file can prove. They do not describe contracts, which it cannot see.
Growth and Contraction are often billing timing rather than plan changes: a retry that lands, a proration, or two charges falling in one month. Lost means payment stopped, which is not the same as a cancellation. Some lost customers pay again within a few months, and then show as Returned.
On cash collected, a customer billed quarterly or yearly shows as Lost in the months between payments and as Returned when they pay again. If many of your customers are not billed monthly, review on normalized recurring revenue. See Cash vs recurring revenue.
The waterfall
The chart title names the basis: Cash Waterfall when the month is on cash collected, MRR Waterfall when it is on normalized recurring revenue. Each bar starts where the previous one ended, so you can see the movements close the gap between the two balances. The axis starts just below the smaller balance so both stay visible, and the chart says where it starts.
Select any movement to see the customers inside it. See Finding the customers behind a figure.
Checking it adds up
When the movements add up to the ending balance, the chart is marked Ties out. When they do not, it is marked Does not tie, and the headline states the gap, for example Off by $312.
Money is shown to the dollar. When rounded rows do not add exactly to a rounded total, Morevy says so under the table, for example Rounded to the dollar, so the rows add to $1 less than the total shown.
The full set of checks sits with the month. See What "reconciled" actually means.