Getting started
Running a monthly review
More sources and clients
How the numbers work
Breaking a month down
Split the movement by plan, region, owner or any column.
Ask in the conversation, for example Break that down by plan. You get one table with a row for each value of that column.
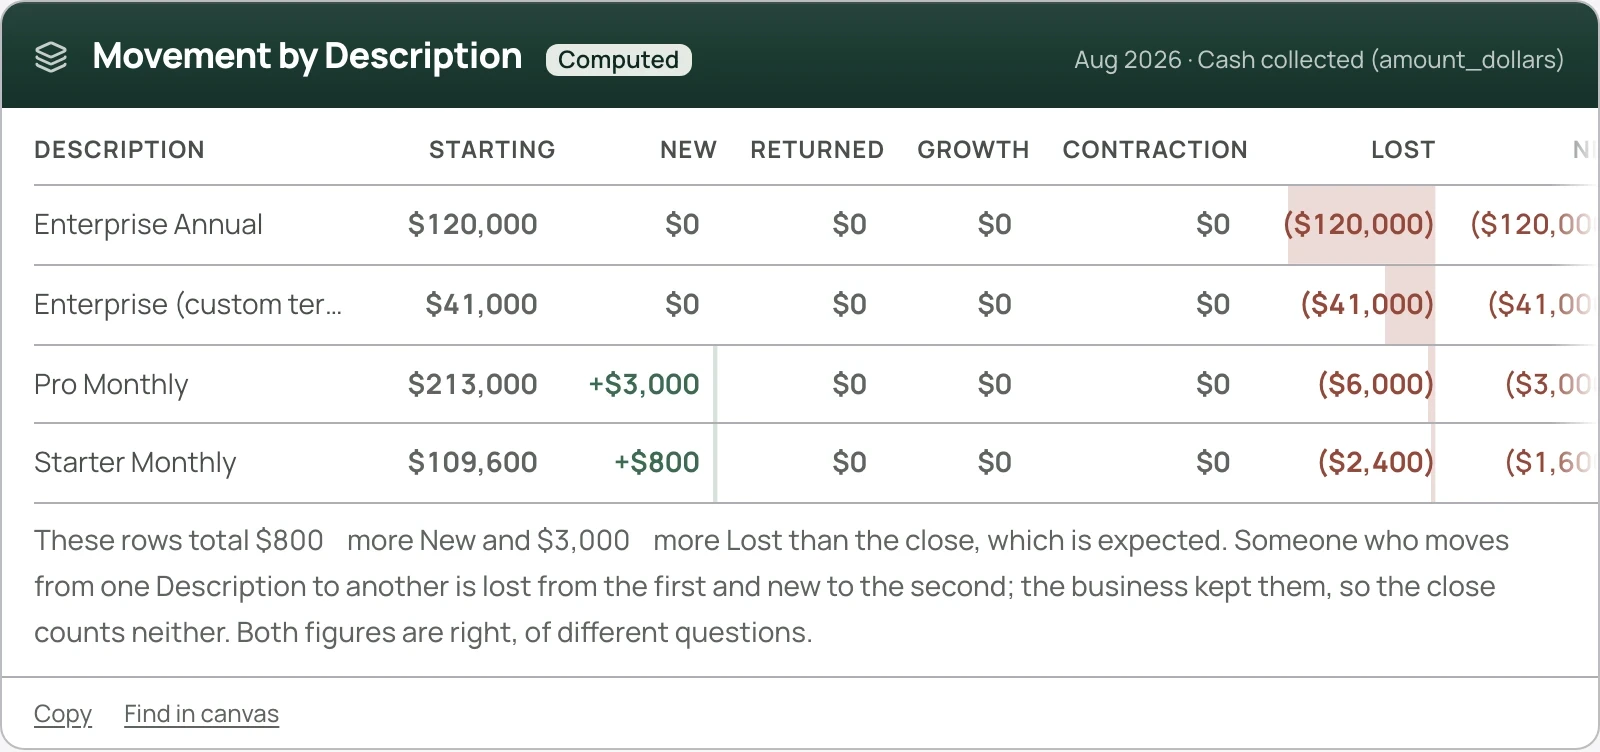
Reading the table
Each row shows Starting, New, Returned, Growth, Contraction, Lost, Net and Ending for one value.
The Starting and Ending columns add up to the month.
The movement columns can add to more than the month. A customer who moves from one plan to another is lost from the first and new to the second, while the business kept them. When that happens, the table says so underneath.
Color is used only when the column has both directions in it.
What you can break down by
Any column with 40 or fewer distinct values: plan, product, region, segment, account owner, payment status. Columns from a customer list count too, so a CRM export lets you break revenue down by owner or region. See Adding more than one file.
Columns with more than 40 distinct values are treated as identifiers and are not offered as breakdowns. When a breakdown has many small values, the table lists the six largest movers and folds the rest into an Others row, so it still adds up. You can cross two columns, for example plan by region; small combinations then fold into Others as well.
Is a loss concentrated or spread?
This is usually the question a breakdown answers. The same loss spread evenly across plans calls for a different response from one that sits almost entirely in a single plan or region.