Skip to content

Recurring revenue analysis SOFTWARE

Computed. Checked. Explained.

- receipts included


Designed for revenue operations that sit between data and decisions. Built for operators by operators.

Revenue movement

ComputedDec 2025 · Normalized recurring revenue
The movements tie out to $41,467.
HoverTap a movement to open the customers behind it. The bricks are drawn from the balance after each movement, so the walk can be checked by hand.
MovementCustomersAmountBalance
Nov 2025204$40,018
New20+$4,016$44,034
Returned4+$826$44,860
Growth11+$1,644$46,504
Contraction6($529)$45,975
Lost19($4,508)$41,467
Dec 2025209+$1,449$41,467
Lost
The 19 customers who moved · Normalized recurring revenue
  • Northwind Labs($289)
  • Halcyon Robotics($249)
  • Bluefin Analytics($198)
  • Corvid Systems($289)
  • Marlowe & Co($99)
  • Tessellate($249)
  • and 13 more($3,135)
19 customers tie out to ($4,508). No model turn.
Reconciled to 4,812 source rows · billing_export_2025.csv · covers through Dec 2025 · illustrative data

How it works

How it worksAn overview of Morevy's review engine across different scenarios

passed the checkscould not be supportedyour judgment, kepta rule the AI cannot cross

they tie checked figures the read kept what it sees read into every later month SourceStripe, or an exportCSV or XLSX Enginedoes the mathsame input, same resultDETERMINISTIC Five checkson every figurethe worst grade wins Youask anything, rulesign the month The recordhow it was madeand who signed Leaves asfour documentsbuilt from the screen AIwrites the read Knowledge, keptrulings · memory · setup Read verdictwhat it sees, first Cut it by plan Who drove Lost? Retention by joining month Compare to the year each answer opens to the customers inside it Workbook Brief Model Deck each ends with the record Seasonality · January budget wave · memory Contract length · annual invoices, spread Event · Starter repricing, old plans kept Credits · v1 refunds · Dec 8 · kept Credits · v2 adjustments · supersedes v1
Scroll sideways to see the whole flow.
9 stepsStripe or a billing export goes in. Customer names are tokenised before anything else happens.

Judgment

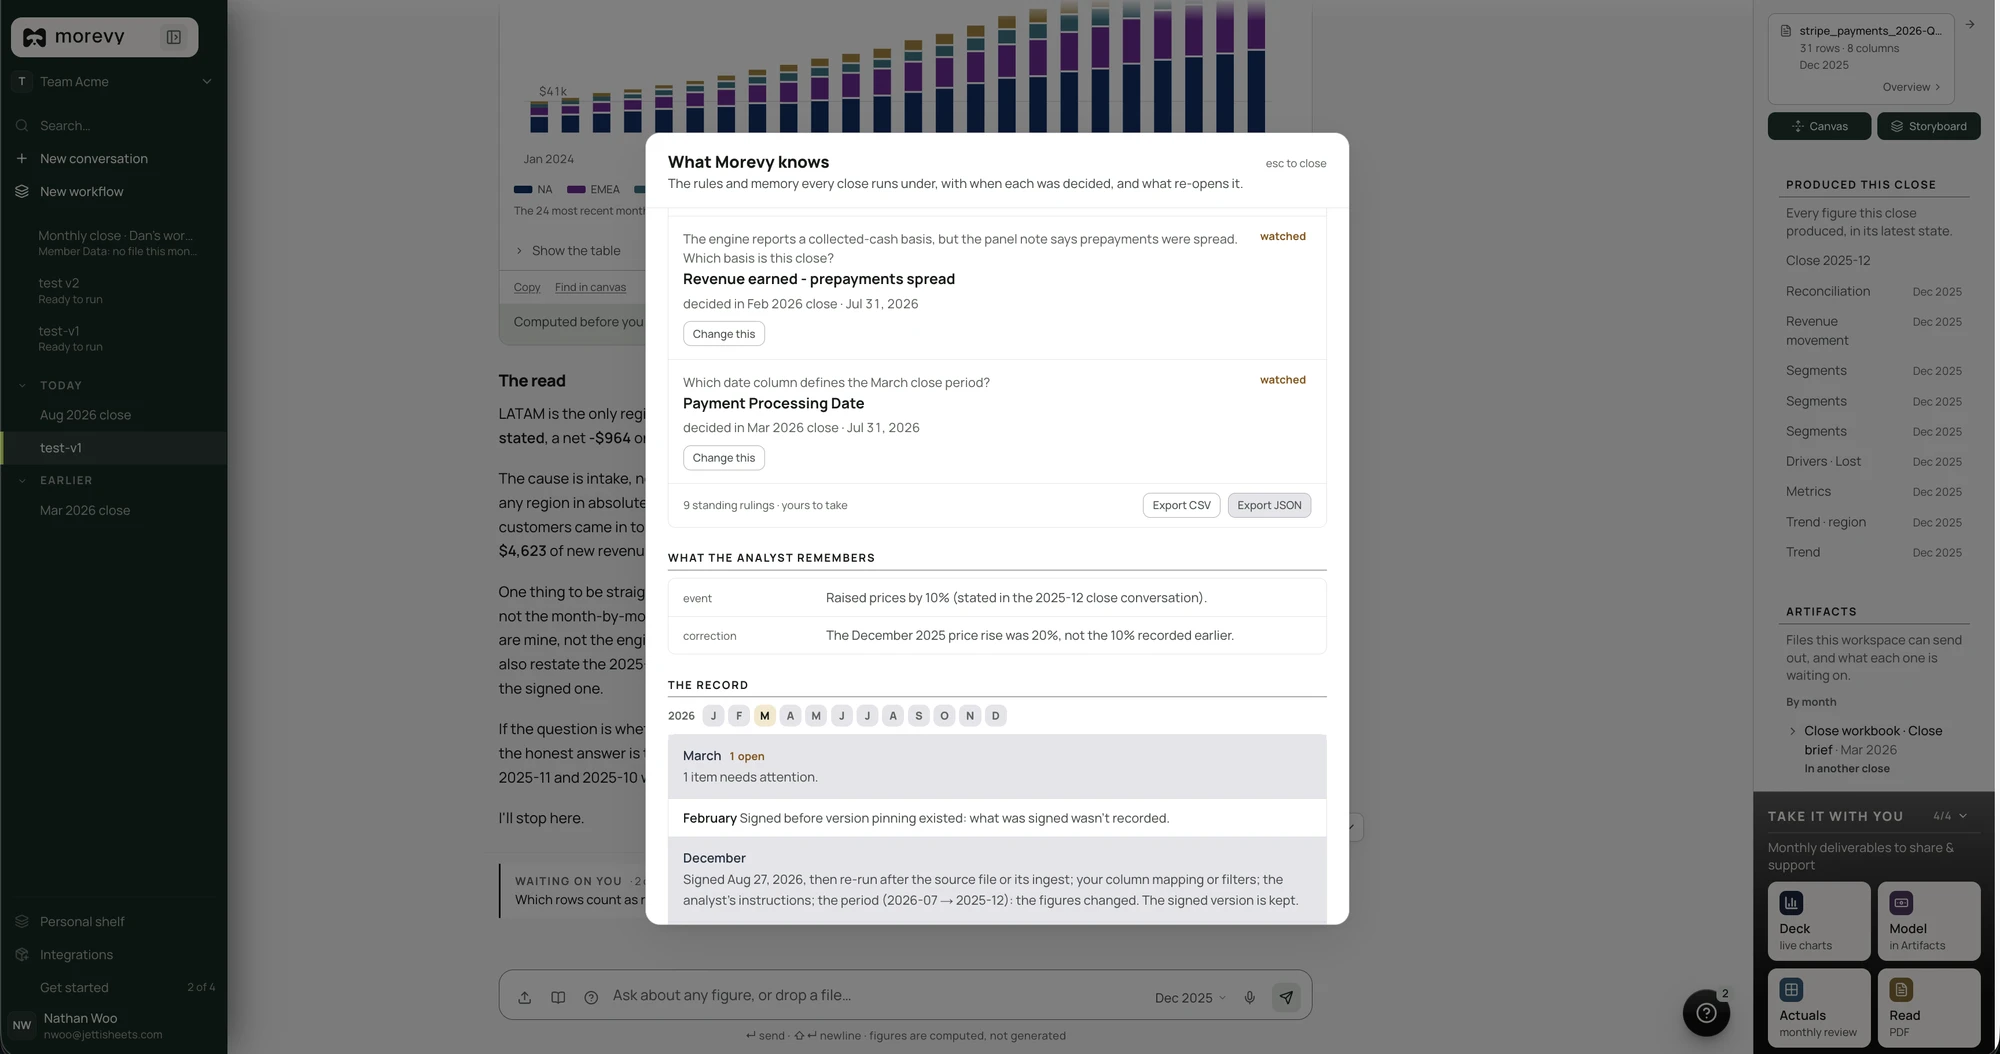
When it has to choose, it asks you once and remembers.

The same question should not come back every month. Answer in your own words; the ruling keeps your name and date and applies to every later month.

Business memory.

What you tell it, it keeps.

Waiting on you.

The one question holding a run, named.

credit rows1 of 1

Credit rows: refunds, or one-time adjustments?

14 rows under "credit", $1,236 in total. Treating them as refunds lowers December by $1,236 and moves two customers from Growth to Contraction. Keeping them as revenue leaves the month as computed.

Period
Dec 2025
Source
billing_export_2025.csv · 4,812 rows
Rows affected
14 · $1,236

Reopens if: a credit row appears without a matching charge.

Why refunds is recommended

Every credit row pairs with a prior charge of the same amount from the same customer within 30 days. That is the shape of a refund, not an adjustment.

What I carry

grows with every month
  • Annual invoices spread across the termJ. Okafor · Dec 15
  • Starter repricing grandfathers existing customersJ. Okafor · Oct 21
  • Months close on the last calendar dayconfirmed at setup

What you can ask for

Click any figure to see the customers inside it.

A total hides the month. Every movement opens to the customers behind it, and they tie out to the movement.

Revenue waterfall.

Starting to Ending, movement by movement.

Segments.

By one column, or two crossed.

Retention and value.

GRR, NRR, logo retention, ARPC, LTV, each with its prior period.

Cohorts.

Retention by joining month. Small cohorts show counts, not rates.

Trend and versions.

One measure across every period. On recompute, what moved and why.

Quote to ask.

Select a sentence of the read and it becomes your next question.

Surfaces

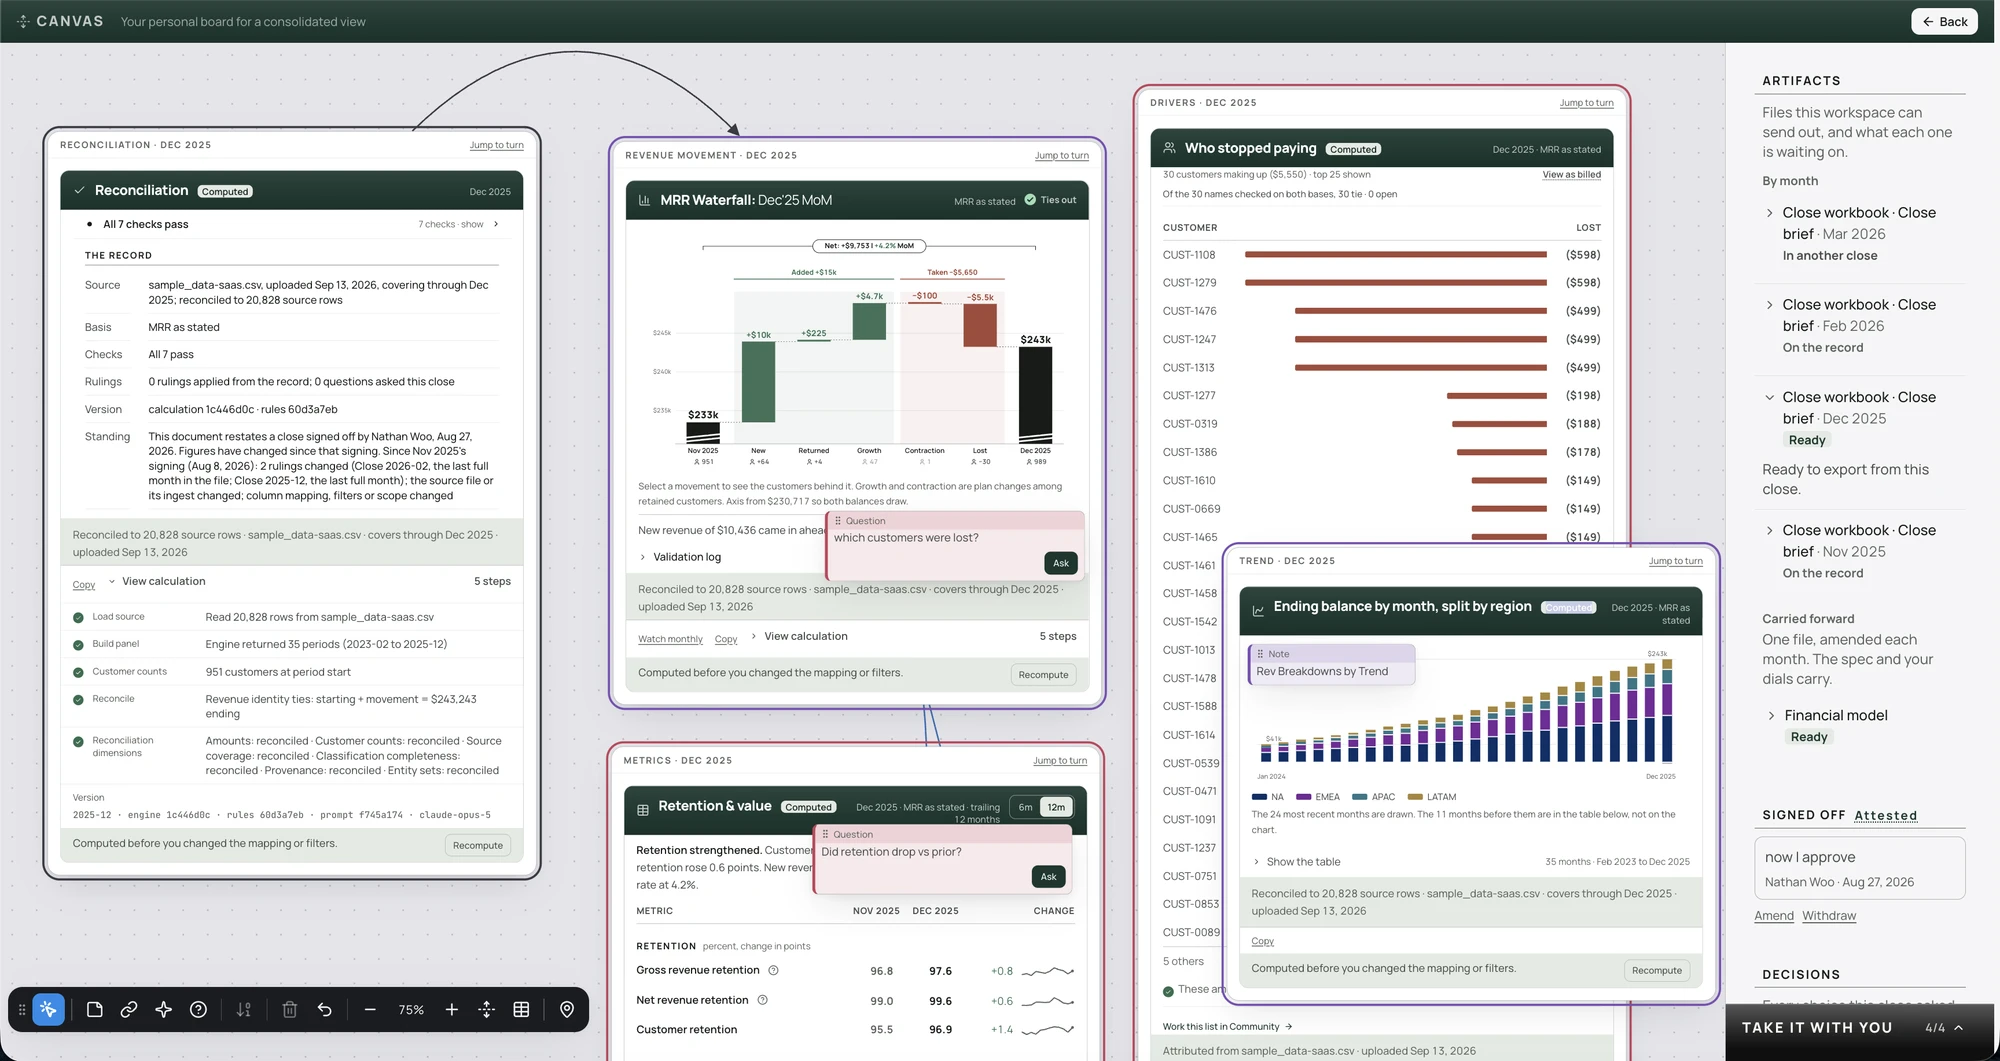
Talk to it, visualize it, or read it as a story.

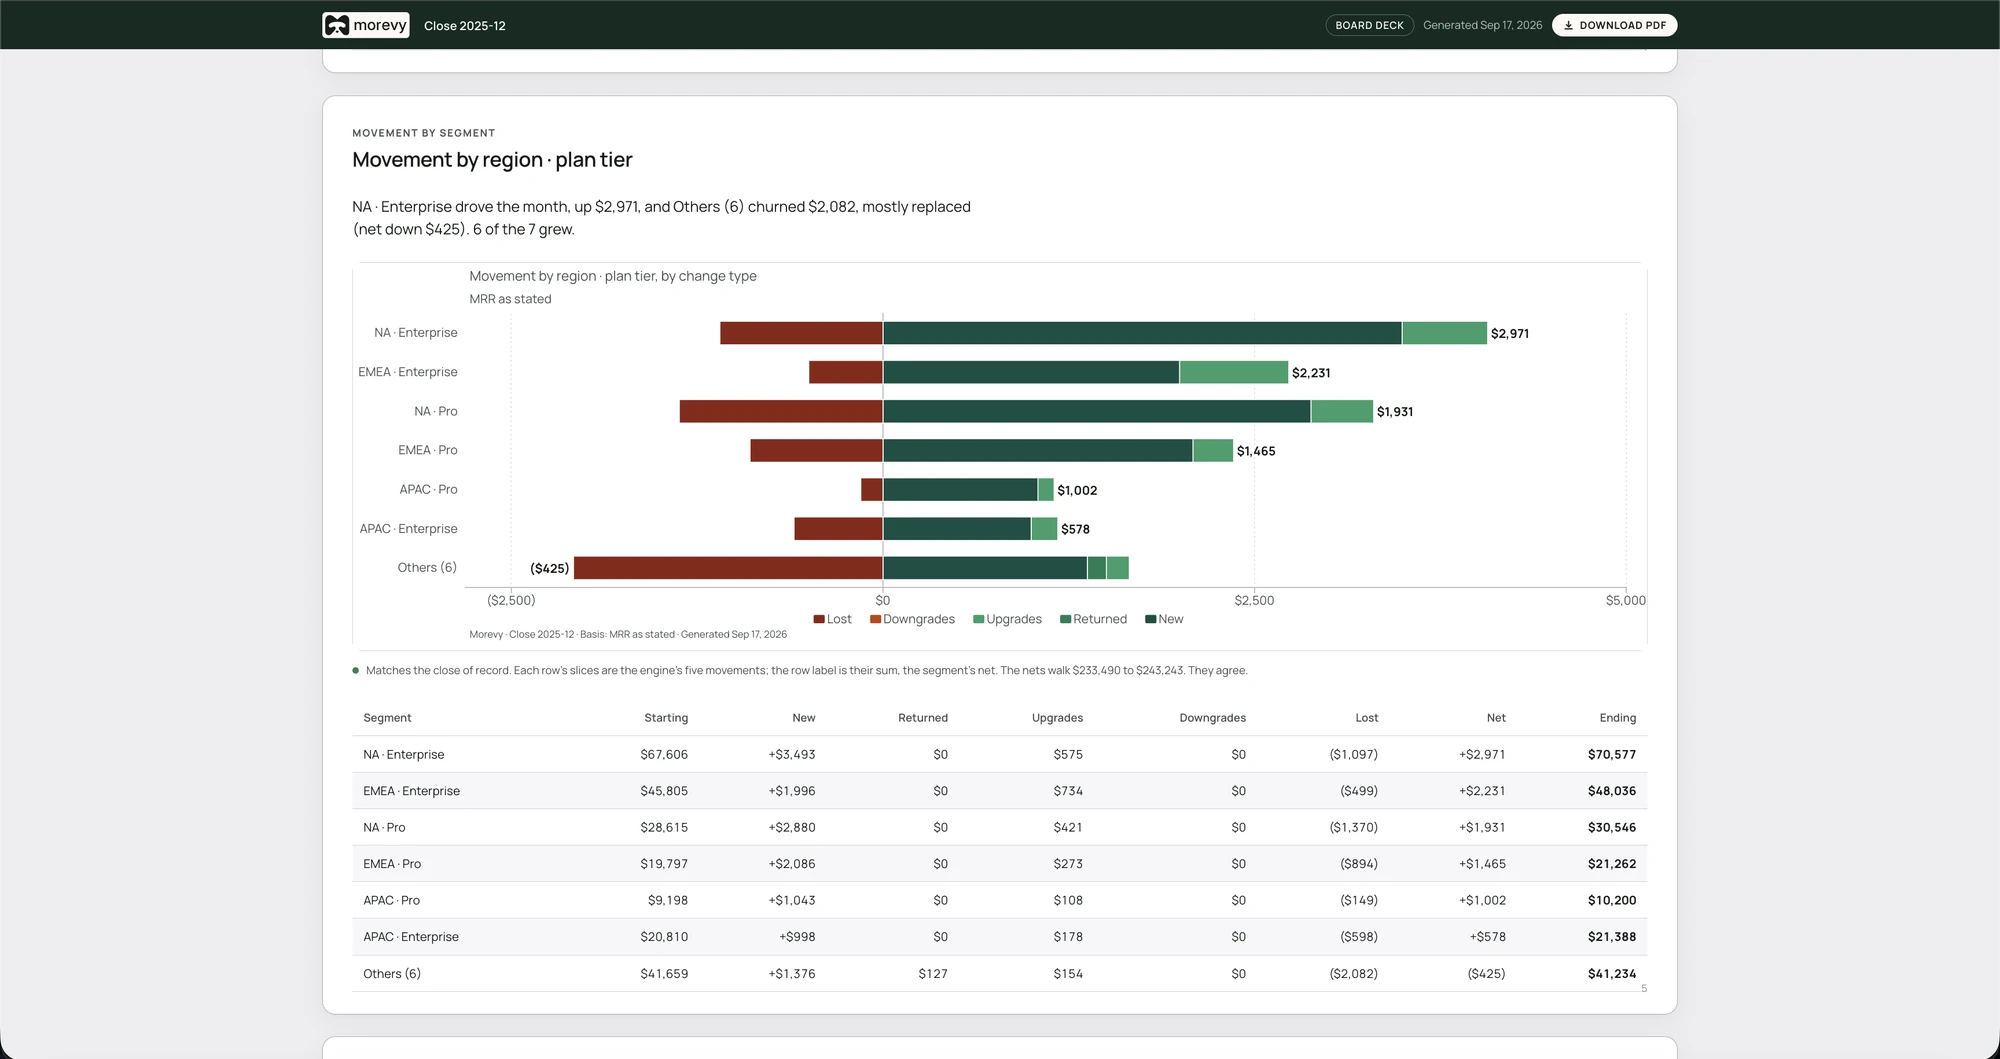
A board deck page: the trend of ending balance by industry over 24 months as a stacked bar chart, with its read and the per-period table

Rich data visualizations. Custom charts and tables specifically designed to help understand and identify SaaS trends.

Rich data visualizations. Custom charts and tables specifically designed to help understand and identify SaaS trends.

The storyboard: numbered panels, what we have and what moved, with the revenue movement chart and its read

Storyboard. The month as a read-only chain. Every figure is bound to a panel; a refusal shows at full weight.

Ask it anything.

Answers come computed from the engine, or it says the figure cannot be supported.

Boundaries

Four things it will not do.

Guess at a number it cannot support.

Change a number you have shown someone, without a new version and the reason.

Replace the software the business runs on.

Present two bases as one figure.

Better decisions start with better context

Join Waitlist