The revenue bridge, explained
Every gap between last month's number and this month's has an explanation. The bridge is that explanation, drawn - and it only counts if it ties out exactly. Comes with an Excel template.
Published
·
Updated
Two numbers a month apart - $243,000 then $251,000 - tell you almost nothing. The business could have grown quietly, or churned a fifth of its customers and papered over the hole with one large deal. A revenue bridge answers which: it takes the starting number, stacks every kind of movement that happened in between, and lands on the ending number exactly.
This guide comes with an Excel template that builds the bridge from two columns. Get the revenue bridge template
What a revenue bridge is
A revenue bridge is a reconciliation of change: opening balance, plus and minus every category of movement, equals closing balance. Applied to recurring revenue it usually runs monthly on MRR or annually on ARR. The projected annual run rate (MRR multiplied by twelve) and ARR can be different numbers, so state which one the bridge is built on.
The same artifact goes by different names. Finance teams often say roll-forward, because the schedule rolls the opening balance forward through movements to the close. [1] Analysts and operators say bridge. Chart people say waterfall. The underlying table is the same everywhere: a starting figure, categorized movements, an ending figure.
The five movements
A recurring-revenue bridge has five behavioral movements, and every dollar of change belongs to exactly one of them.
New - revenue from customers who were not paying last period and are paying now, and have never paid before.
Expansion - the increase from customers who were paying and now pay more: upgrades, added seats, price increases that stuck.
Contraction - the decrease from customers who still pay, but less: downgrades, removed seats, discounts granted.
Churn - the full recurring value of customers who were paying and now pay nothing.
Reactivation - revenue from customers who had churned and came back. Kept separate from new because a returning customer is different information.
New, expansion and reactivation are additions; contraction and churn are subtractions. A customer who swaps one $500 plan for a different $500 plan is either nothing or simultaneous expansion-and-contraction - pick one treatment and keep it. A paused subscription is churn only if your definition says so.
How to build a revenue bridge from customer-month totals
If you have a customer-month table - each customer's normalized recurring total for each month, the foundation built in the MRR guide - the bridge falls out of comparing adjacent columns.
For each customer, compare last month to this month.
What the two months show | Movement | Amount |
|---|---|---|
Present now, absent last month, never seen before | New | Their total this month |
Present in both months at a higher number | Expansion | The difference |
Present in both at a lower number | Contraction | The difference |
Absent now, present last month | Churn | Their full last-month value |
Present now, absent last month, but seen in some earlier month | Reactivation | Their total this month |
Sum each class across customers and the movements are done.
A worked miniature with fabricated numbers. March MRR is $10,000 across some set of customers. During April: two new customers start at a combined $1,200; one existing customer upgrades by $600; a customer who left in January returns at $200; one customer downgrades by $400; and customers worth $800 cancel.
Movement | Amount | Running total |
|---|---|---|
Starting MRR | 10,000 | 10,000 |
New | 1,200 | 11,200 |
Expansion | 600 | 11,800 |
Reactivation | 200 | 12,000 |
Contraction | (400) | 11,600 |
Churn | (800) | 10,800 |
Ending MRR | 10,800 |
Ending MRR computed independently from the April customer-month column must also be $10,800. If it is not, the classification missed something, and the gap is the size of the miss.
Movements are dated by the month whose balance they change, not by when the paperwork happened. An upgrade signed in April that bills from May is a May expansion.
The waterfall chart
The chart most people picture is a row of floating bars: the opening balance stands on the ground, each movement hangs in the air starting where the previous bar ended, gains in one color and losses in another, and the closing balance comes back down to the ground.
How to draw it in Excel or Google Sheets
Put the bridge in two columns: the movement, then the amount. Enter contraction and churn as negative numbers.
In Excel, select both columns, then choose Insert, Waterfall. [2]
Right-click the ending bar and choose Set as Total. Until you do, Excel stacks it on top of the last movement. Do the same for the starting bar.
In Google Sheets, insert a chart and pick Waterfall as the chart type. Subtotals are added under Customize, Series. [3]
A waterfall drawn from wrong or unreconciled numbers is wrong - it looks authoritative because the form implies the numbers were checked.
The movement identity is the standard
This is the standard: starting MRR + new + expansion + reactivation - contraction - churn = ending MRR, to the dollar, every period.
If the opening balance and the movements sum to the ending balance exactly, the bridge reconciles. That is necessary, and it is not proof. The tie does not prove the two balances are complete, or that the movements are labeled right, and two errors of the same size in opposite directions cancel. A returning customer counted as new still ties exactly. So does one customer under two IDs, where a renewal becomes churn plus new. If the movements do not sum, a difference is left unexplained. Absorbing it into whichever movement was computed last is a plug. Find the difference instead.
Common reasons an attempt fails to tie:
A mid-month plan change counted in two movements.
Refunds subtracted in the bridge but not in the balances, or the reverse.
Opening balance pulled from one report while movements come from another, computed under slightly different rules.
Reconcile first, render second.
A revenue bridge template in Excel, and its limits
The file below does the two-period version of that comparison, over up to five thousand accounts.
Morevy Movement Bridge (sample).xlsx - Excel workbook.
It takes two columns: what each account was billed in the opening period, what it was billed in the closing period. Paste those two columns and the four movements, the account counts and the checks compute themselves.
Paste billed amounts and the result is a bridge of billings. Paste each account's normalized monthly amount and it is an MRR bridge.
What a worked revenue bridge looks like
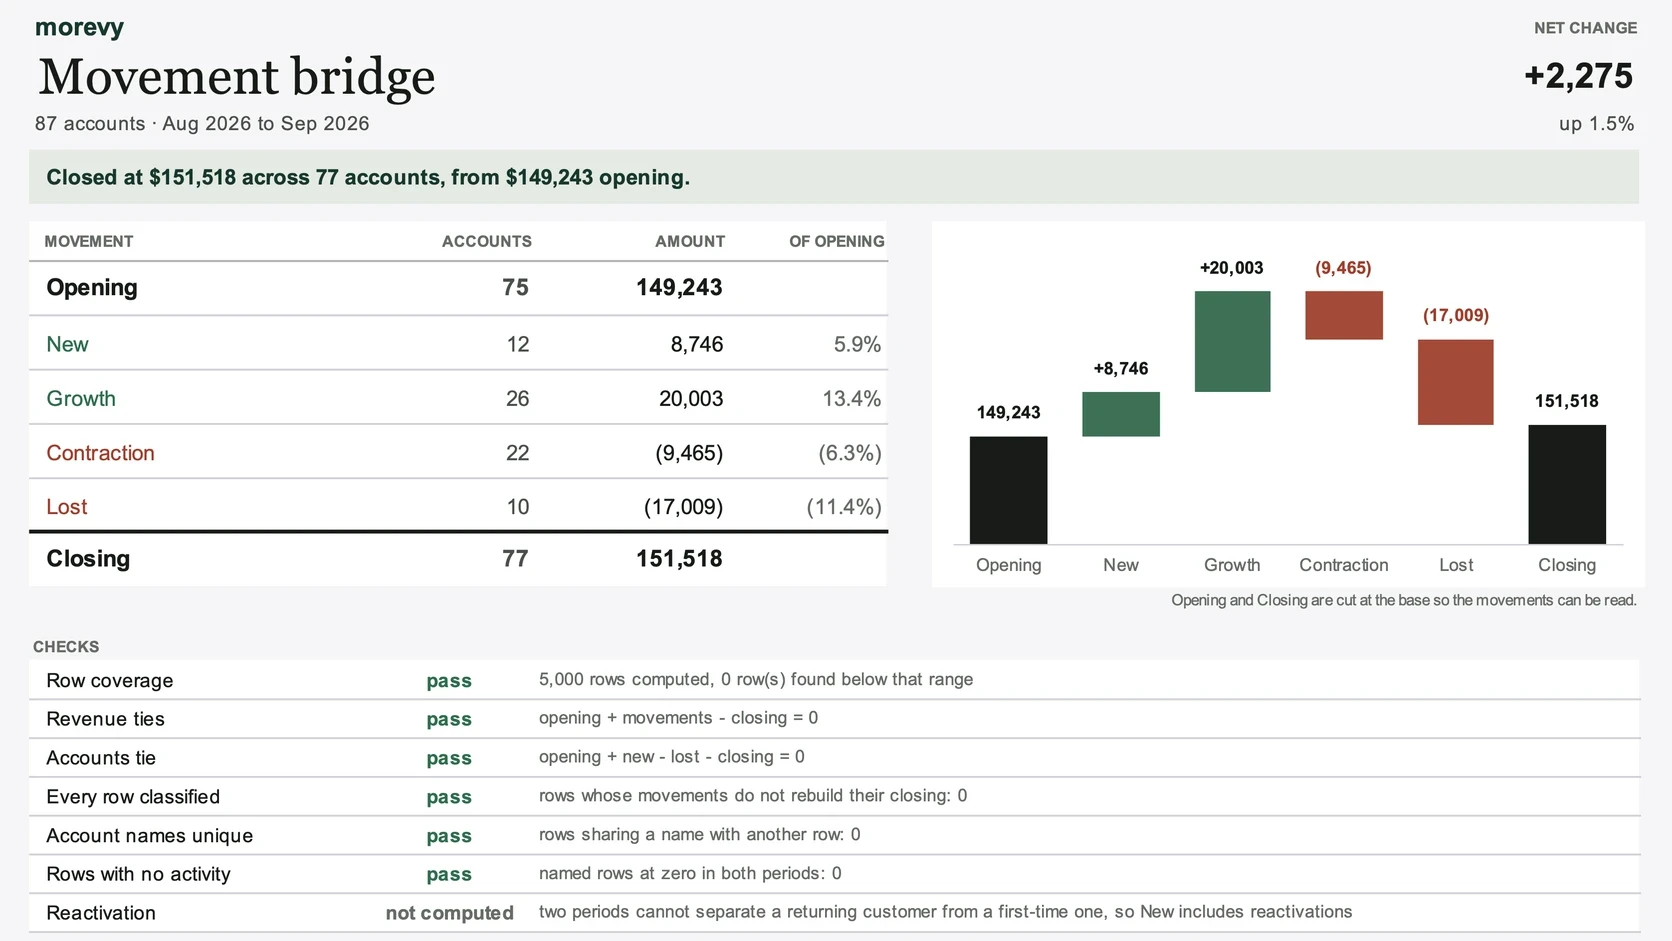
Fabricated numbers throughout, on a made-up book of 87 accounts.
The template computes new, growth, contraction and lost, because two billing columns can show that money grew, shrank or stopped, never that a contract was upgraded or cancelled. The guide above calls the same movements expansion and churn.
Movement | Amount | Accounts |
|---|---|---|
Opening | 149,243 | 75 |
New | 8,746 | 12 |
Growth | 20,003 | 26 |
Contraction | (9,465) | 22 |
Lost | (17,009) | 10 |
Closing | 151,518 | 77 |
Up 1.5%. Read as a total, that is a quiet period: revenue grew slightly, the account count grew by two, nothing demands attention.
The bridge says otherwise. Gross adds were 28,749 and gross losses were 26,474. Ten accounts billed nothing in the closing period, taking 17,009 with them, which is 11.4% of opening revenue and more than every new account combined. And of the 20,003 in growth, 12,400 is a single account.
Without that account's 12,400 increase, the period is down 10,125.
What the Excel template does not do
Four movements, not five. It does not compute reactivation, and it says so on its face rather than in a footnote.
Separating a returning customer from a first-time one requires knowing whether they paid in some month before the opening period, and two columns cannot see that far back. So a customer who lapsed and came back is counted as new.
This matters more than a missing category usually would, because the bridge still ties. When reactivation is material to your business, you need the customer-month table from the MRR guide, not a two-column comparison.
The file cannot tell a cancellation from a billing gap, or a deliberate downgrade from a partial period.
Three of the six checks test the file, not your data. Revenue ties, accounts tie and every row classified are computed from the same two columns they check, so they fail only when a formula has been damaged. They do not tell you that the two columns you pasted are right.
Why the customer level matters
The first thing a bridge does when it works is provoke a question, and the question is always who. Who is the $800 of churn? Is the expansion movement ten small upgrades or one account? A bridge computed only at the aggregate level can render the chart but cannot answer.
Computing movements at the customer level means every movement is a list of names with amounts before it is a bar. Movements grouped by plan, region, customer size or acquisition channel turn one chart into a comparison. The segment movements must sum to the segment's own opening and closing balances, and the segments must sum to the whole.
Morevy's revenue movement view is built on the same discipline - every movement opens to the customers behind it.
When a spreadsheet is enough
For a company with one billing system, a few hundred customers, and simple monthly plans, a well-kept spreadsheet bridge is a fine instrument, and building more than that is premature. The triggers for outgrowing it are situational:
More than one billing system, or a provider migration that split the history.
Plan changes mid-term, backdated corrections, or prepaid periods that turn movement classification into a judgment call.
A board, lender, or diligence process asking how a figure was computed, not just what it is.
Metric definitions disputed across finance, sales, and RevOps, with no recorded ruling on which is right.
The person who built the spreadsheet being the only person who can explain it.
None of those apply: keep the spreadsheet. Two or more: the monthly rebuild is already costing more than it appears to, and the risk is concentrated in whoever maintains it.
Reading a bridge without fooling yourself
Gross beats net. A month where expansion is +$5,000 and contraction is -$4,800 nets to almost nothing and is one of the most informative months the business can have. Show the movements at full size. A bridge built by comparing two month-end totals shows each customer's net change, so an upgrade and a downgrade by the same customer inside the month show as one movement.
One name can be a whole movement. A single large account churning reads, at chart distance, like a churn problem. It might be a concentration problem instead, and the response to those differs completely. Before narrating a movement, look at its distribution.
Reactivation can dress up churn. Fold returning customers into new and acquisition looks stronger than it is. Net them against churn and gross churn looks better than it is. Keep the movement separate.
Compare like periods. A February bridge sits next to a January bridge with three fewer days, and annual billing cycles put renewal-heavy months on a calendar. A movement that swings on schedule is seasonality, not a trend.
Conclusion
A revenue bridge is a small idea held to a strict standard: every dollar of change between two balances, counted once, categorized behaviorally, summing exactly. Build the movements from customer-level comparisons so every bar can be opened to names, refuse the plug when the identity does not tie, and read gross movements rather than nets.
Get the revenue bridge template
Sources
[1] Corporate Finance Institute. Corkscrew Calculation.
Frequently asked questions
What is a revenue bridge?
+
A reconciliation of change in recurring revenue: the opening balance, plus new, expansion and reactivation, minus contraction and churn, landing exactly on the closing balance. It is the same artifact finance teams call a roll-forward and chart tools call a waterfall.
What is the difference between a revenue bridge and a waterfall chart?
+
The bridge is the reconciled table of movements; the waterfall is the chart form used to draw it - floating bars that each start where the previous one ended. Any decomposition of change between two totals can be drawn as a waterfall, but a revenue bridge is only trustworthy if its movements sum exactly to the ending balance.
What are the five movements in an MRR bridge?
+
New (customers who started paying), expansion (existing customers paying more), reactivation (churned customers who returned), contraction (existing customers paying less), and churn (customers who stopped paying). The first three add; the last two subtract.
Why does my bridge not add up to my ending MRR?
+
The usual causes are a mid-month plan change counted in two movements, refunds handled differently in the movements than in the balances, or opening and closing balances pulled from a differently-computed report. The identity failing is useful - it means an error exists and is findable. One customer under two IDs is not among the causes: it turns a renewal into churn plus new and still ties.
Should reactivation be counted as new revenue?
+
No. A returning customer is different information from a first-time customer: counting them as new overstates acquisition and understates recovery. Keeping reactivation as its own movement also keeps gross churn honest, since netting returns against departures hides both.