Revenue Segmentation Strategy: A Finance Leader's Guide
A method for splitting recurring revenue into groups that behave differently, a five-point test for whether a segment is real, and the rule that every segment sums back to total MRR.
Published
·
Updated

TL;DR: A revenue segmentation strategy splits recurring revenue into customer groups that behave differently, then tracks new, expansion, contraction and churn for each group. A segment earns its place only if the accounts inside it look alike and the segments differ from each other. Every segment must sum back to total MRR. This guide covers how to choose segments, how to test whether a segment is real, and how to put segment reporting into your monthly close.
Most segmentation advice is written for marketers deciding who to target. This guide is not. It is for the person who has to explain the number: finance leaders, RevOps, fractional CFOs and CSOs at subscription companies.
No single scheme fits every subscription business, and this post won't pretend one does. What it offers is a method for building one that fits yours, and a test for whether it works. When the board asks "why did revenue move?", you should be able to answer with figures per segment instead of one blended number.
Why finance needs segmentation more than marketing does
Recurring revenue segmentation splits your customer base into groups that respond differently to pricing, upsell and retention efforts, then reports revenue movements for each group separately.
Marketers segment to decide who to target. Finance segments money you already collect, not money you hope to collect. That changes the question:
A marketer asks, "Who should we target?"
A finance leader asks, "Which groups produced this month's MRR change, and can I prove it?"
The second question needs segments tied directly to billing data, because that is where the figures reconcile. Segmentation won't fix a shaky base number. If your MRR calculation needs work, start with our guide to MRR formula and reconciliation. For the full monthly method behind all of this, see The Complete Guide to Recurring Revenue Analysis.
Which segments to start with
Three cuts cover most subscription companies, and billing data already carries all three.
Plan. Starter, Growth, Enterprise. Is each plan earning its place?
Contract size. Bands of annual contract value. Larger accounts don't matter more as customers, but they are usually where the expansion potential sits, and attention is finite.
Tenure. Customers at month 3, 12 and 24 of their lifetime. Is the existing base growing, or is new-customer revenue flattering it?
Add the cuts finance already tracks, such as billing interval, industry and acquisition channel, and you have a workable menu. Usage (heavy, medium and light accounts) and product mix (multi-product versus single-product) are useful later, once the first three are reporting cleanly.
What this list can't do is tell you which cuts are right for your business. That depends on how your revenue moves. Start with two or three, profile them over six to twelve months, and add more only when a new cut changes an actual decision.
Five tests a segment must pass before you report on it
A segment only earns its keep if it behaves differently from its neighbors. Inside a segment, accounts should look alike. Between segments, they should not. And a few billing fields should place an account in its segment without a manual review each month.
For finance, that becomes a five-point check before any segment goes into a report:
Distinct behavior. Do segments show different retention, expansion or discounting patterns? If two trace the same curve, merge them.
Stable membership. Can you assign an account from a few billing fields? If it takes a spreadsheet and a judgment call every month, the segment will drift, and last quarter's numbers will stop meaning the same thing as this quarter's.
Enough volume. A segment of eight accounts swings wildly on one cancellation. Combine small groups until no single customer can dominate the result.
A named owner. Someone in pricing, success or sales must be able to act on the segment's numbers. A segment nobody owns is a slide, not a tool.
Clean reconciliation. Segments must sum to total MRR with nothing left over.
More schemes fail quietly on the last test than on the other four. It is often the first thing a sharp board member checks, and if the segments don't tie to the topline, the conversation stops being about the insights and starts being about the math.
Why retain versus churn is not enough
Retention research argues that finance teams must move past binary retain-or-churn metrics and break revenue change into its actual causes: price increases, plan upgrades, usage down-sells. Segmentation makes that breakdown useful, because the same cause plays out differently across groups.
Here is an illustrative example. Total MRR rose 2% in a month, from $400,000 to $408,000. On its own, that looks healthy. Split by plan:
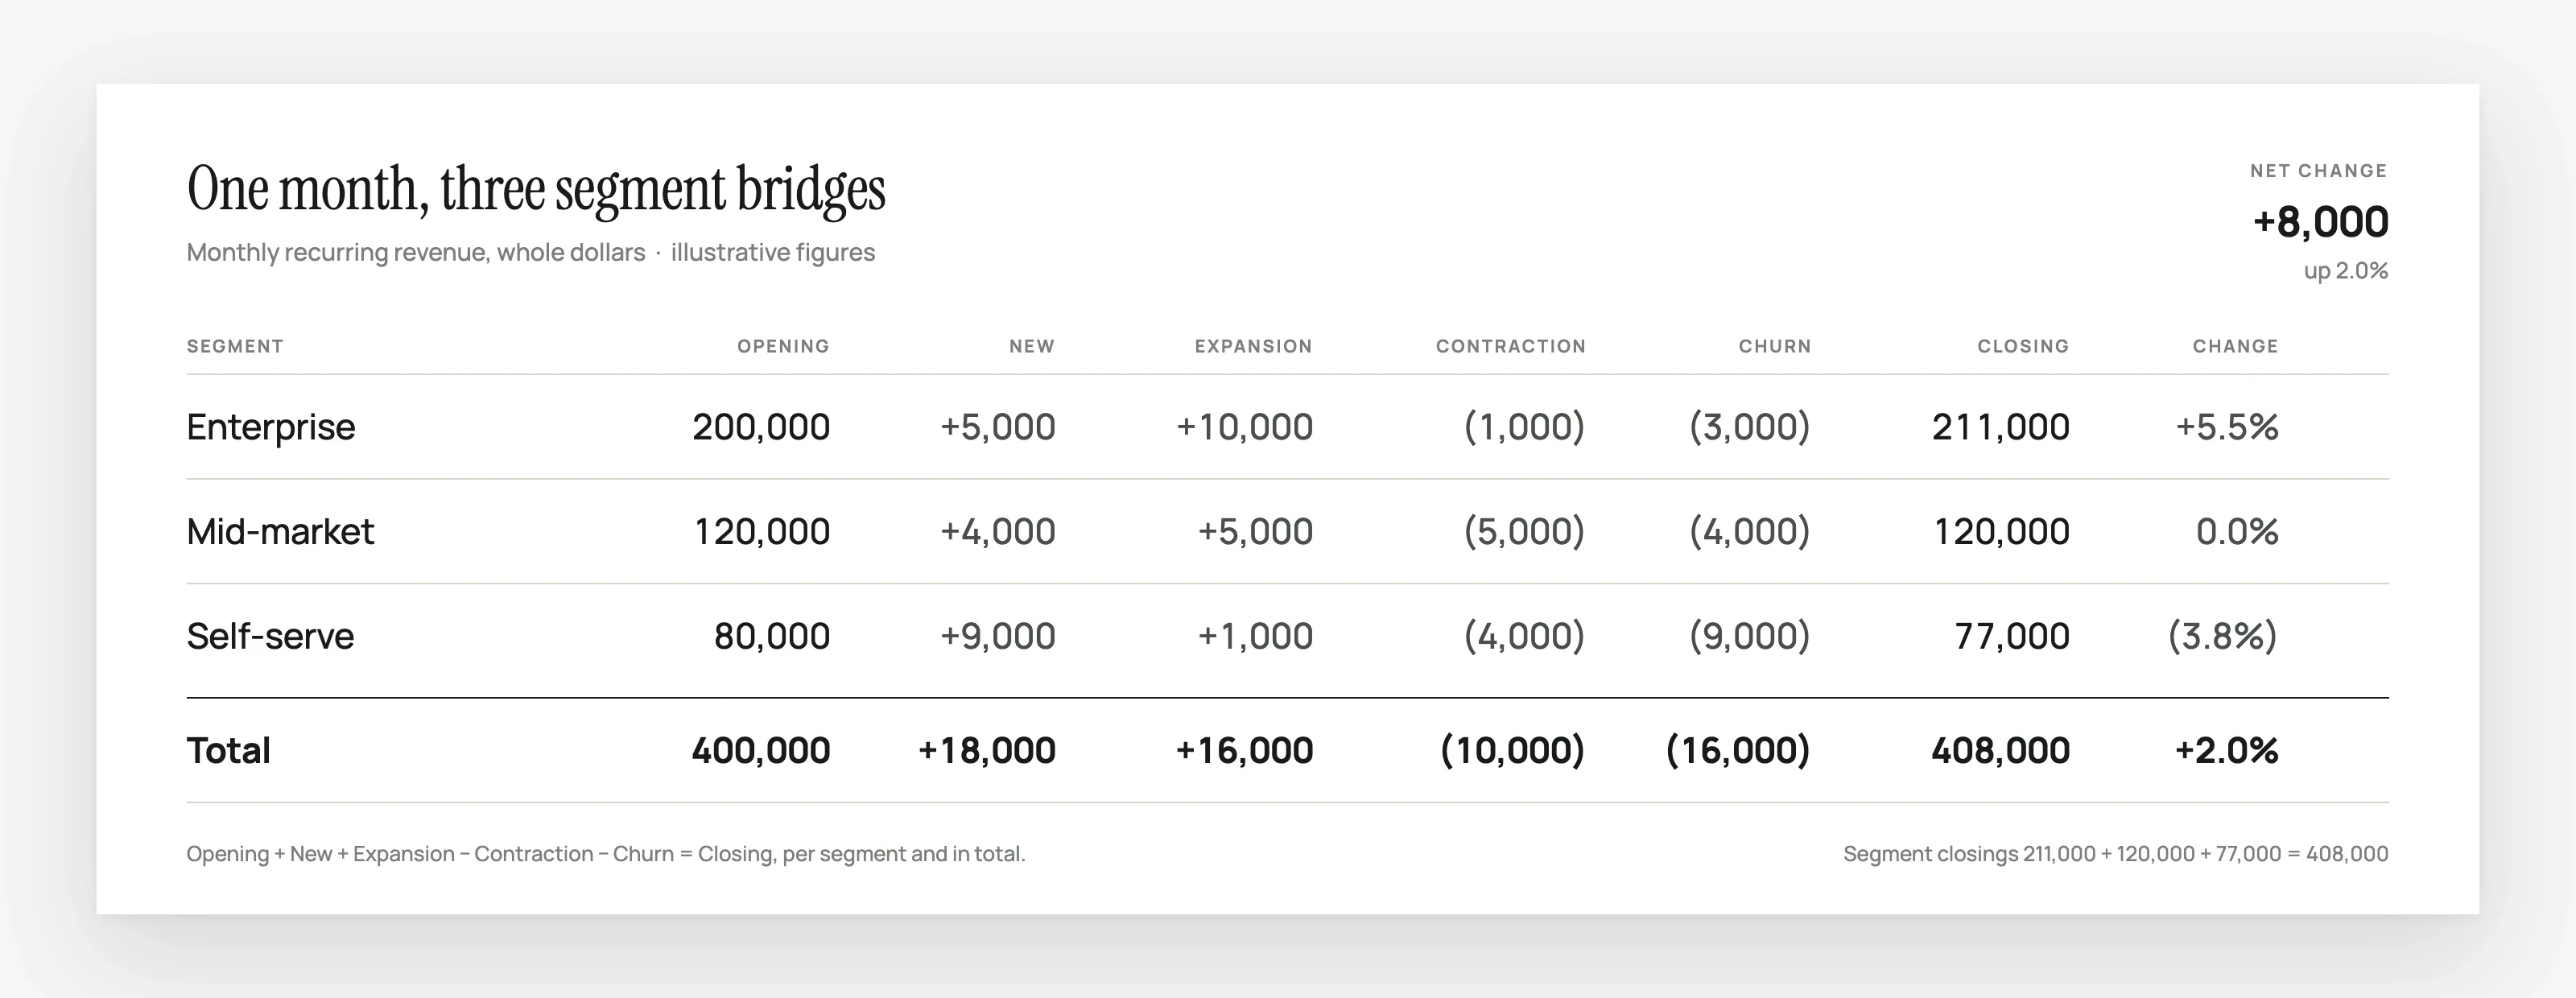
Enterprise is expanding on added seats with almost no churn. Mid-market is flat, every gain offset by a cut. Self-serve is adding logos, but contraction and cancellations outrun them. The three segment closings add to the total exactly.
One blended number, three different stories, three different owners. That is what segmentation is for. Our post on turning MRR bridges into narrative drivers shows how to write each movement up so the reader sees the cause, not just the delta.
One bridge per segment
A bridge states: opening revenue, plus new, plus expansion, minus contraction, minus churn, equals closing revenue. Build one per segment and one for the total, then confirm the segment bridges add up to the total bridge, as above. If a segment bridge doesn't tie out, the problem is usually classification logic, not arithmetic. For annual contracts, our ARR bridge explainer covers the same structure at a different cadence.

Track segments as cohorts moving through time
A monthly snapshot shows where a segment stands. It does not show where it is heading. The HBS note on net revenue retention (NRR) recommends viewing cohorts as trajectories, not static slices. The difference separates natural churn from deliberate moves, such as a planned migration to new pricing.
Two practices make cohort analysis hold up over time:
Group by maturity, not only by signup date. Compare customers at month 3, 12 and 24 of their lifetime. This stops a strong sign-up month from flattering the existing base, so the NRR you report reflects customers you already had.
Work top-down where you can. Account-by-account retention modeling is slow and gets noisy fast. Most finance teams work from cohort-level aggregates and drill into individual accounts only for the largest movements or clear exceptions.
Use benchmarks by segment, and say where they came from
Blended benchmarks are a starting point, not a target, and contract size is one of the clearest dividing lines. SaaS Capital reports that B2B SaaS companies with annual contract values (ACV) above $250,000 show a median gross revenue retention of 95%, with lower retention below that threshold. A separate 2025 benchmark makes a related point: analyzing NRR by segment and product is standard practice among high performers, since higher-ACV products tend to retain better.
So if your small-contract segment retains worse than enterprise, that may be the market working as expected, not a failure. Compare each segment with peers of similar ACV, and judge the trend against your own history rather than a blended industry number. For the people side of keeping revenue, this SaaS retention playbook is a useful companion read.
One caution: benchmarks shift between publishers and between years. Name the source and the date whenever you quote one in a board deck. An uncited benchmark invites the wrong follow-up question.
How to build the scheme, step by step
A scheme built in the wrong order collapses at the first board review. Start from the decisions, not the data.
Start from the decisions. List what segmentation should inform: pricing changes, packaging, success staffing, forecast assumptions. If no decision is attached to a segment, it probably does not need to exist.
Pull a clean base. Use billing data as the system of record for MRR. Tie every customer to a plan, interval, start date and contract size before drawing any lines.
Pick two or three cuts. Plan, contract size and tenure cover most subscription companies. Resist cutting the data twelve ways on day one.
Profile each segment. Measure new, expansion, contraction and churn per segment over at least six to twelve months. Shorter windows rarely surface a real pattern.
Run the five-point test. Merge or redraw segments that fail any part of it.
Write the rules down. Document exactly how an account enters a segment and how exceptions, such as discounts, custom contracts and paused subscriptions, are classified. Without written rules, the definitions will drift.
Report on a rhythm. Put segment bridges into the monthly close with a short note explaining what moved and why.
Review quarterly. Segments age. Last year's niche plan may be your largest group this year, and a segment that once passed the behavior test may no longer.
Four pitfalls that undermine segment reporting
Good design can still produce misleading reports if the month-to-month handling breaks down. These are the failures we see most often.
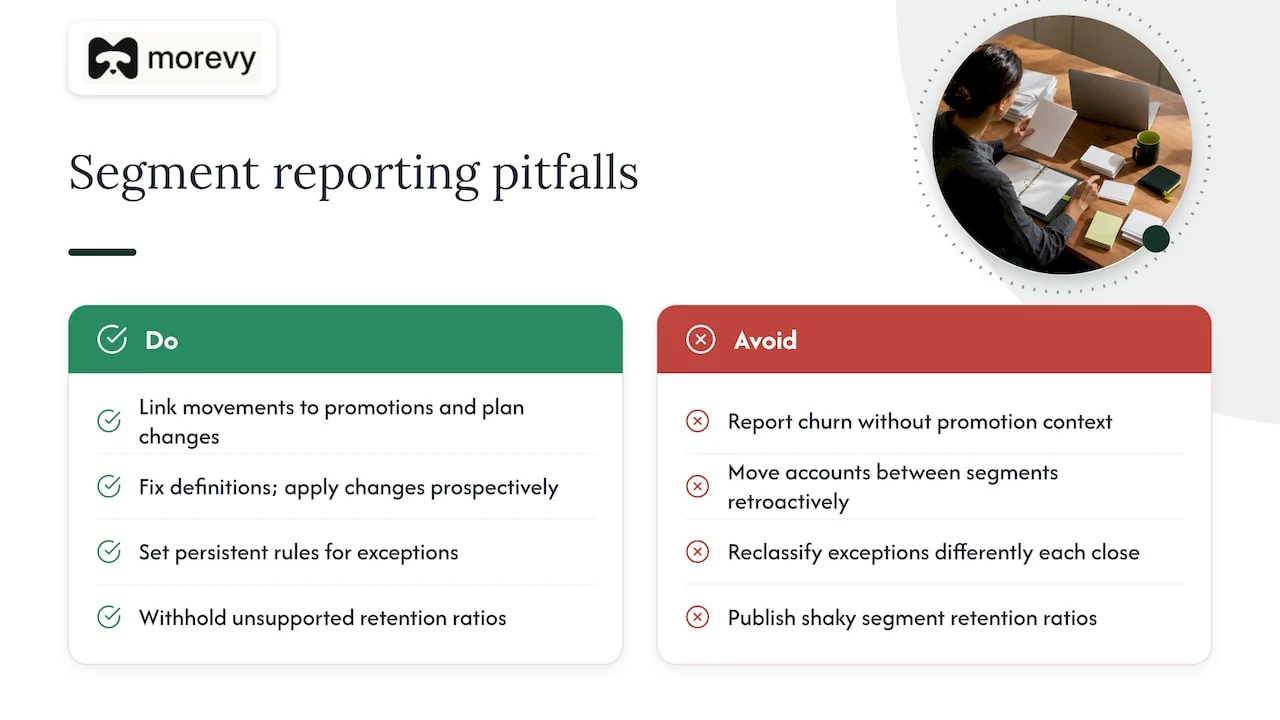
Ignoring promotions and packaging. Report churn without noting that the cohort was sold on a discount, and you lose the explanation along with the trigger. Link segment-level movements to plan changes, promotions and upsell cycles. Without that context, a one-time event looks like a trend.
Segments that move retroactively. If an account can be reclassified into a different segment after the fact, history gets rewritten and last quarter's report stops matching this quarter's. Fix definitions before reporting, and apply any changes prospectively with a note explaining what changed.
Hidden exceptions. Credits, refunds, paused subscriptions and one-off invoices distort MRR quietly. Without a persistent rule for each type, the same item gets reclassified differently at every close. Our post on defensible revenue reporting covers why automation needs a layer of judgment on top of it, not instead of it.
Ratios the data cannot support. Sometimes a segment's payment data is too thin to compute an honest retention ratio. Withholding the figure is the correct call in that case. Publishing a shaky number is not. We cover when that applies in this piece on withheld retention ratios.
A segmentation strategy is only as good as your ability to defend it
Segmentation itself is rarely the hard part. The hard part is the question that comes right after the slide: "Show me the accounts behind that number."
We built Morevy because that question keeps coming up, so we hold to three principles:
Traceable movements. Every segment figure should trace from the topline down to the transaction level. No segment number should be a black box that someone has to take on faith.
Persistent rules. Decide once how to treat a refund or a credit, and every later month follows that ruling.
Numbers before narrative. We don't let an AI model calculate figures. New, expansion, contraction and churn come from fixed calculations, and the commentary is written only after the math is checked.
A segmentation strategy that can't survive "show me the accounts" is a slide. One that can gives finance, success and sales the same verified facts to act on.
Putting it into your monthly close
If your billing runs through Stripe or another payment system, the data for this work already exists. You don't need to rebuild your process or replace the tools you already use.
Morevy's recurring revenue analysis software sits on top of that billing data. It reconciles MRR to billing, breaks each movement down by customer and segment, and drafts a readable explanation across cohorts, plans and periods for your review. It won't estimate a figure your data cannot support. It names the figure as withheld, states the reason, and waits.
Prefer to build the process yourself first? That is a reasonable place to start. Our guide to automating revenue categorization logic and the recurring-revenue close walkthrough cover how to get there step by step.
Frequently asked questions
What is segment-wise revenue?
+
Segment-wise revenue is recurring revenue reported separately for each customer group, by plan, contract size or tenure, for example. Each segment has its own opening balance, new revenue, expansion, contraction and churn. The segments should sum to total revenue with nothing left unaccounted for.
What are the three types of product-related segmentation strategies?
+
Usage-based segmentation (heavy, medium and light users), behavioral loyalty segmentation (core versus non-core customers), and benefit or need-based segmentation (pricing tiers matched to value outcomes). All three are described in a marketing analytics practitioner's guide. Most subscription companies combine at least two of the three.
How many revenue segments should a subscription business track?
+
Start with two or three cuts and a small number of segments. Each needs enough accounts that one cancellation cannot swing the result, and each must behave differently from the others. Add more segments only when a new cut changes an actual decision, not because the data allows for it.
How often should we revisit our revenue segmentation strategy?
+
Quarterly, with changes applied prospectively and a note explaining what changed and why. Rewriting history to fit a new definition makes period-to-period comparisons unreliable. Revisit sooner than quarterly if you launch a new plan or change pricing.
What happens if revenue segments don't reconcile to total MRR?
+
Every insight built on them becomes open to challenge. A board member or auditor who finds the gap will reasonably question the rest of the report, not just the segment line that doesn't tie. Reconciliation is not optional; it is the condition under which segment figures are worth reporting at all.